This metric is ideal for analyzing short-term sentiment, market volatility, and distribution dynamics driven by recent buyers.
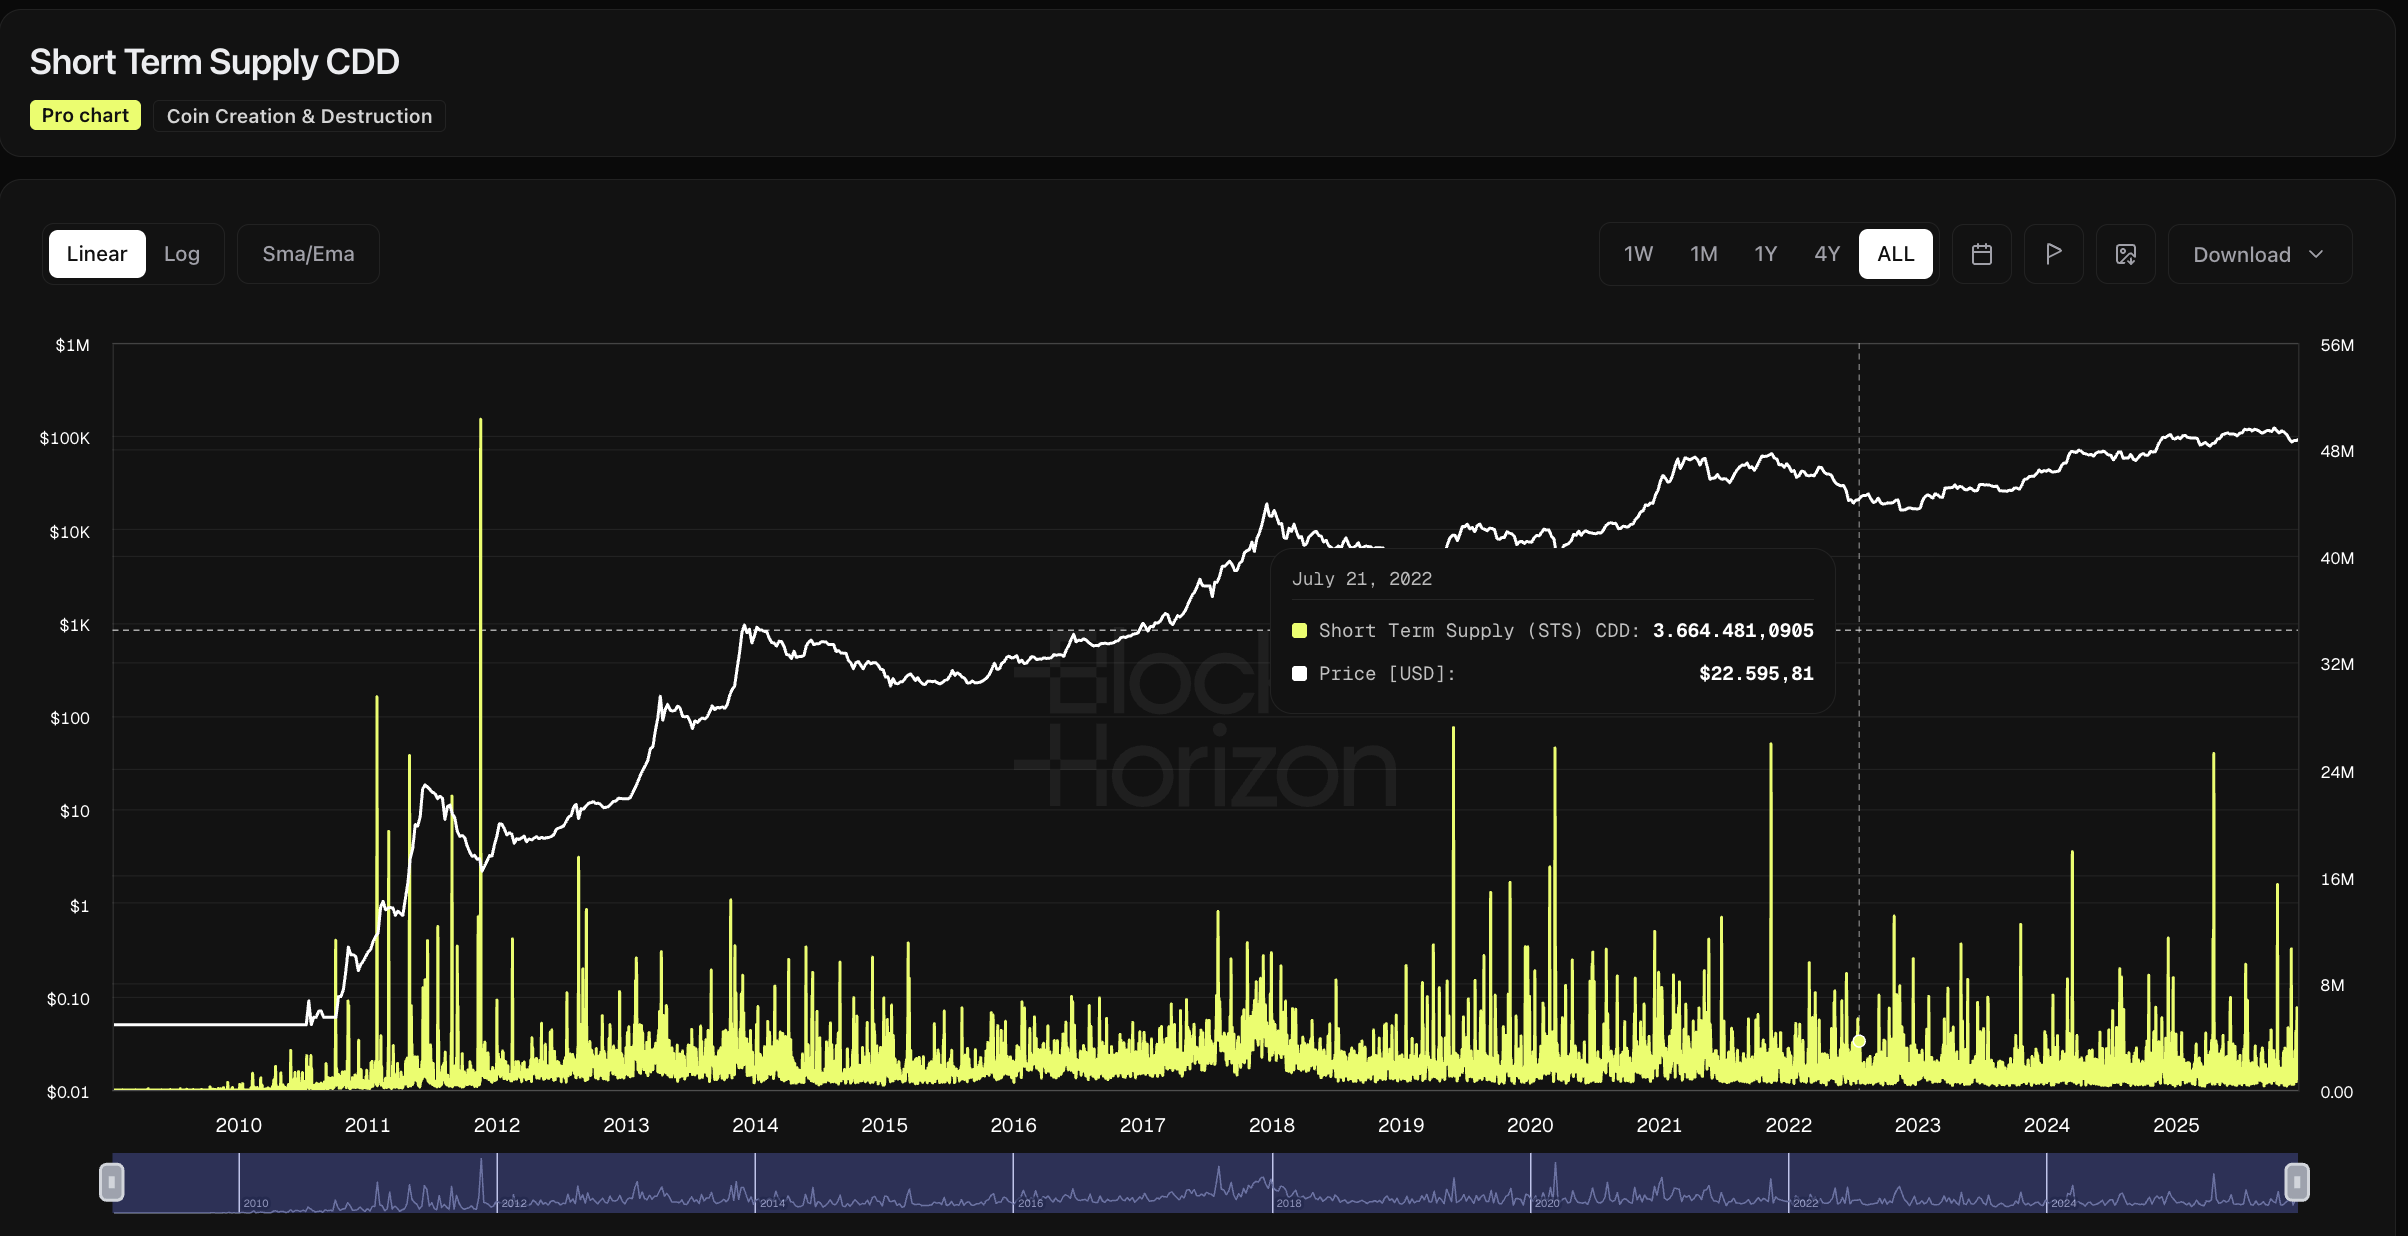
Short-Term Supply Coin Days Destroyed Indicator (Chart Tutorial)
The Short-Term Supply Coin Days Destroyed (STS CDD) indicator focuses exclusively on the behavior of short-term holders — participants who acquired coins recently and are more likely to react quickly to price movements.
Unlike long-term holder metrics, STS CDD highlights speculative activity, emotional responses, and short-lived market dynamics. It is particularly effective for identifying profit-taking, panic selling, and momentum-driven behavior during rallies and corrections.
This makes STS CDD a powerful tool for understanding short-term sentiment shifts that often precede volatility.
What Is Short-Term Supply (STS) CDD? (Simple Definition)
To understand STS CDD, it helps to break it down step by step.
Coin Days
Coin Days = number of coins × number of days unspent
Coin Days Destroyed (CDD)
When coins move, their accumulated coin age is destroyed
Recently acquired coins destroy fewer coin days than older coins
Short-Term Supply CDD
STS CDD measures the total coin days destroyed only for coins held by short-term holders
Short-term holders are typically defined as entities holding coins for a relatively short duration, often associated with speculative activity
Key Insight: STS CDD isolates fast-moving supply, making it far more sensitive to market sentiment and short-term price action than long-term metrics.
Why STS CDD Matters for On-Chain Analysis
Short-term holders are often the most reactive participants in the market.
Why Analysts Use STS CDD
Tracks speculative behavior in real time
Highlights profit-taking during rallies
Detects panic selling during drawdowns
Reflects emotional market responses
Helps identify short-term distribution phases
Insight: Sharp changes in STS CDD often occur before or during periods of elevated volatility, making it a valuable early warning signal.
How to Read the STS CDD Chart
Interpreting STS CDD requires focusing on spikes, trends, and context.
High STS CDD Indicates
Rapid movement of recently acquired coins
Profit-taking during upward price momentum
Panic selling during corrections
Elevated speculative activity
Increased short-term sell pressure
Low STS CDD Indicates
Reduced activity among short-term holders
Fading speculative interest
Market calm or consolidation
Potential accumulation by more patient participants
Why This Matters: Short-term holders tend to amplify market moves. Persistent high STS CDD suggests the market is being driven by speculative flows rather than conviction.
What Low STS CDD Means
Low readings suggest short-term participants are stepping back.
Low STS CDD Typically Indicates
Reduced speculative trading
Exhaustion of panic selling
Market stabilization
Potential transition toward accumulation
Lower short-term volatility
Insight: Extended periods of low STS CDD often follow sharp corrections and may signal that weak hands have already exited.
Historical Patterns in STS CDD
STS CDD behaves differently across market phases.
Bull Markets
Frequent spikes in STS CDD
Short-term holders take profits into strength
Elevated speculative churn
Bear Markets
Suppressed STS CDD
Reduced trading activity
Declining speculative interest
Sideways / Neutral Markets
Stable STS CDD levels
Balanced short-term participation
Compression before directional moves
How Traders & Analysts Use STS CDD
Practical Applications
Identify speculative excess during rallies
Detect panic-driven selling
Gauge short-term market sentiment
Anticipate volatility expansions
Confirm distribution near resistance
Support tactical trading decisions
STS CDD is especially effective when used alongside price action, volume, and long-term holder metrics.
Combining STS CDD With Other Metrics
STS CDD becomes even more powerful in context.
Common Pairings
Long-Term Supply (LTS) CDD → conviction vs speculation
90D CDD → short-term noise vs macro behavior
ASOL → average age of spent outputs
Dormancy Flow → valuation and cycle positioning
Insight: High STS CDD combined with low LTS CDD often signals short-term speculation without long-term conviction.
Limitations of the STS CDD Metric
Important Considerations
Highly sensitive to short-term volatility
Can generate frequent spikes
Does not identify specific wallets
Less useful for long-term cycle analysis
Should not be used in isolation
STS CDD works best as a tactical indicator, not a standalone signal.
Pro Tips for Using the STS CDD Chart
Focus on spikes, not long-term averages
Treat repeated spikes during rallies as caution signals
Watch for collapsing STS CDD after panic events
Compare STS CDD with price momentum
Use divergences to anticipate volatility shifts
Combine with long-term metrics for confirmation
Frequently Asked Questions (FAQ)
1. What does Short-Term Supply CDD measure?
It measures the coin days destroyed when short-term holders move their coins, reflecting speculative activity.
2. Who are short-term holders?
Entities holding coins for a relatively short duration, often associated with trading and speculation.
3. What does high STS CDD indicate?
Increased speculative selling, profit-taking, or panic-driven movement.
4. What does low STS CDD indicate?
Reduced speculative activity and calmer market conditions.
5. Is STS CDD useful for long-term analysis?
Not on its own — it is best suited for short-term sentiment and volatility analysis.
6. Can STS CDD help identify market tops?
Elevated and persistent STS CDD during rallies can signal speculative excess near resistance levels.
7. Should STS CDD be used alone?
No — it is most effective when combined with long-term holder and macro indicators.


.jpg)


.png)