Days Until Halving Indicator: Bitcoin Halving Countdown Explained
,
November 26, 2025
⏤
7 min read
Powered by Block Horizon proprietary Bitcoin datasets.
TL;DR
Days Until Halving shows how many days remain until the next scheduled Bitcoin block reward halving.
The metric is essential for understanding future supply shocks, market cycles, and miner economics.
As the halving approaches, miner revenue changes, network dynamics shift, and investor sentiment typically increases.
This chart helps traders, creators, and analysts anticipate volatility and prepare for long-term structural changes in Bitcoin issuance.
The Days Until Halving chart shows exactly how close we are to Bitcoin’s next supply reduction event. Since halvings are the core driver of Bitcoin’s long-term supply schedule, tracking this countdown gives you a clear forward-looking view of when network incentives, miner revenue, and market psychology will shift.
If you want to understand Bitcoin’s macro cycles, this countdown is one of the most important long-term metrics.
What Is the Days Until Halving Metric? (Simple Definition)
The Days Until Halving metric measures the estimated number of days remaining until the next Bitcoin halving.
Here’s what that means in plain language:
Bitcoin halvings reduce miner block rewards by 50%.
They happen at specific block heights, not on preset calendar dates.
This countdown is based on current block production speed.
It’s effectively a timer for the next major structural supply change.
Key notes:
Bitcoin halvings occur every 210,000 blocks.
Each halving reduces supply inflation and alters miner economics.
Markets often begin reacting long before the halving actually occurs.
The countdown helps everyone — from miners to long-term investors — understand when the next shift in Bitcoin’s issuance will take place.
Why Days Until Halving Matters
Halvings are not minor technical events. They are the backbone of Bitcoin’s monetary design.
Here’s why the metric matters:
Halvings drastically reduce the amount of new Bitcoin entering circulation.
Every halving in history has preceded major long-term bullish cycles.
As the halving approaches, the scarcity narrative strengthens.
Investor interest, media attention, and on-chain activity all tend to rise.
Miners prepare months in advance by upgrading hardware and optimizing efficiency.
This metric is a forward-looking indicator of potential supply-driven shifts — one of the few that Bitcoin gives us with near-mathematical certainty.
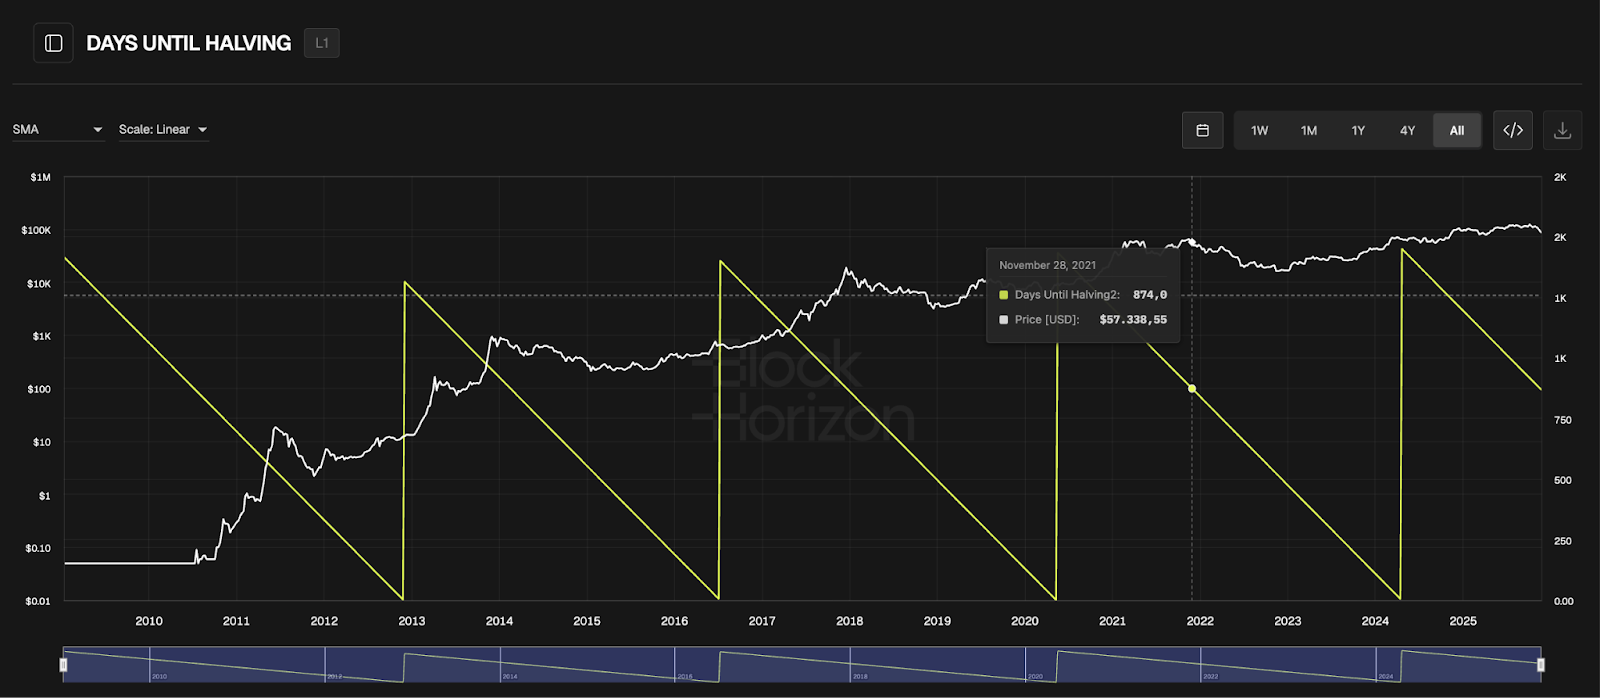
How to Read the Days Until Halving Chart
The countdown chart does one thing extremely well: it shows how close we are to the next supply cut.
Here’s how to interpret it:
What the chart represents:
A real-time countdown to the next halving
A timeline showing how far along the current 210,000-block cycle is
Historical context from past halving cycles
Acceleration or deceleration depending on block times
A simple signal for long-term accumulation or cycle-timing strategies
What viewers should look for:
Sharp drops in remaining days → we are getting close
Long stretches of stability → halving is still far away
Small fluctuations → natural shifts in average block times
The closer the countdown gets to zero, the more market dynamics start to change.
What a Decreasing Days Until Halving Value Signals
As the halving approaches, the countdown accelerates — and so does market behavior.
Key indicators:
Increasing attention from investors
Stronger narratives around Bitcoin’s finite supply
Higher on-chain activity and fee pressure
Miners preparing for revenue cuts
Speculation typically ramps up months in advance
Why this matters:
Approaching halvings often trigger anticipatory rallies, increased volatility, and stronger market sentiment. Traders, creators, and long-term holders use this period to position themselves ahead of structural shifts in issuance.
What It Means When Halving Is Far Away
When the halving is years out, the market tends to relax.
Indicators of distance from the event:
Stable issuance conditions
Lower hype and reduced speculative activity
More predictable miner economics
Calmer supply dynamics
Market focus shifts to fundamentals, infrastructure, and long-term network growth
When the next halving is still far off, the network enters a quieter phase — usually with fewer narrative-driven surges.
Understanding Bitcoin Halvings (Core Concept)
A quick refresher for anyone who needs it:
Halvings occur every 210,000 blocks (~4 years).
They cut block rewards by 50% each time.
Designed to reduce Bitcoin’s supply inflation predictably over time.
Key historical halvings:
2012
2016
2020
2024
Next expected around 2028
This mechanism ensures long-term scarcity and separation from traditional monetary systems.
Halvings are at the heart of Bitcoin’s monetary policy — not price predictions, not hype, not narratives. Just math.
Historical Halving Patterns & Market Cycles
Every halving has set the stage for a completely new multi-year cycle. Here are the major patterns:
2012 Halving
First supply reduction.
Kicked off a massive 12–18 month bull run.
2016 Halving
Miners upgraded hardware and consolidated operations.
Led directly into the 2017 bull market.
2020 Halving
Preceded the biggest bull run in Bitcoin’s history.
2020–2021 saw huge institutional inflows and global adoption.
2024 Halving
Reduced block rewards from 6.25 → 3.125 BTC.
Marked a new era where miner revenue depends more heavily on fees.
Early cycle dynamics already show different miner behavior compared to past halvings.
Common patterns across cycles:
Anticipation and narrative growth
Volatility in the months around the halving
Post-halving consolidation
Extended multi-year bull runs
Cycles don’t repeat perfectly — but the rhythm is hard to ignore.
How Analysts & Investors Use the Days Until Halving Metric
Here’s how professionals actually use this countdown:
Cycle timing — Identify where we are in the 4-year halving cycle.
Accumulation planning — Position long-term portfolios before supply cuts.
Volatility monitoring — Expect increased swings near countdown zero.
Miner behavior analysis — Track operational stress as rewards drop.
Long-term trend identification — Align macro moves with supply changes.
Narrative tracking — Watch how sentiment evolves as the date approaches.
If you’re trying to understand Bitcoin’s macro picture, this one metric offers more clarity than almost anything else.
How Miners React to Halving Countdowns
Mining is one of the most sensitive parts of the ecosystem when halvings approach.
Before the halving:
Miners optimize costs aggressively
Larger mining firms expand operations
Inefficient miners shut down older hardware
Hash rate becomes more volatile
Some miners “race” to collect as many full-reward blocks as possible
After the halving:
Rewards drop by half instantly
Some miners become unprofitable and shut rigs off
Hash rate may dip before recovering
Difficulty adjusts to stabilize block production
Fee dynamics may change depending on network activity
Miner behavior is one of the best leading indicators of how the network will react to the upcoming cycle.
Potential Market Behavior as the Halving Approaches
Halvings are both fundamental events and psychological catalysts.
Typical market behavior:
Speculation increases
Open interest in derivatives rises
Narrative-driven rallies begin
Long-term investors accumulate
Media coverage attracts new entrants
Volatility spikes in the weeks before and after the event
The halving affects Bitcoin’s economics, but it also directly influences investor psychology — and that combination has shaped every major bull market so far.
Limitations of the Days Until Halving Metric
As powerful as it is, this metric isn’t perfect.
Important limitations:
It cannot predict price direction by itself
Not a short-term trading signal
Market reactions differ each cycle
Requires context from other indicators
Countdown is an estimate because block times vary
You should use this metric as a macro compass, not as a minute-by-minute trading tool.
Pro Tips for Using the Days Until Halving Chart
Some practical pointers for getting the most out of it:
Track how quickly the countdown accelerates or slows
Watch miner behavior as the event approaches
Expect emotional market reactions close to the halving
Use the chart to identify where we are in the broader cycle
Focus on long-term issuance changes, not short-term swings
The closer we get to the halving, the more valuable this chart becomes.
Frequently Asked Questions (FAQ)
1. What is Bitcoin halving?
A programmed reduction of block rewards by 50%, occurring roughly every four years.
2. How often does halving occur?
Every 210,000 blocks — about once every four years.
3. Why does halving affect Bitcoin price?
It cuts supply, increases scarcity, and historically coincides with long-term bullish cycles.
4. How accurate is the Days Until Halving countdown?
It’s an estimate based on average block production speed, which can vary slightly.
5. What happens to miners after a halving?
Revenue drops by half. Inefficient miners may shut down; others upgrade or optimize.
6. Does halving always cause a bull market?
No guarantee — but each halving has historically preceded multi-year price increases.
7. How should traders use this metric?
To understand the current position within the halving cycle, anticipate volatility, and plan long-term strategies.
To see the real-time countdown and understand exactly where we are in the current cycle, explore the live Days Until Halving chart on BlockHorizon. It’s the simplest way to track Bitcoin’s next major supply shift and stay ahead of the market.


.jpg)