Coin Blocks Created Indicator: A Complete Guide to Understanding Network Holding Behavior
,
December 4, 2025
⏤
7 min read
Powered by Block Horizon proprietary Bitcoin datasets.
TL;DR
Coin Blocks Created measures how many “coin blocks” were generated over a given period.
A coin block = coins held × days unspent, so this metric reveals how many new holding days were added across the network.
High values signal strong holding behavior, accumulation, and long-term confidence.
Low values signal spending, redistribution, or profit-taking as holders move coins.
The chart helps identify accumulation, distribution, and market cycle transitions with clarity.
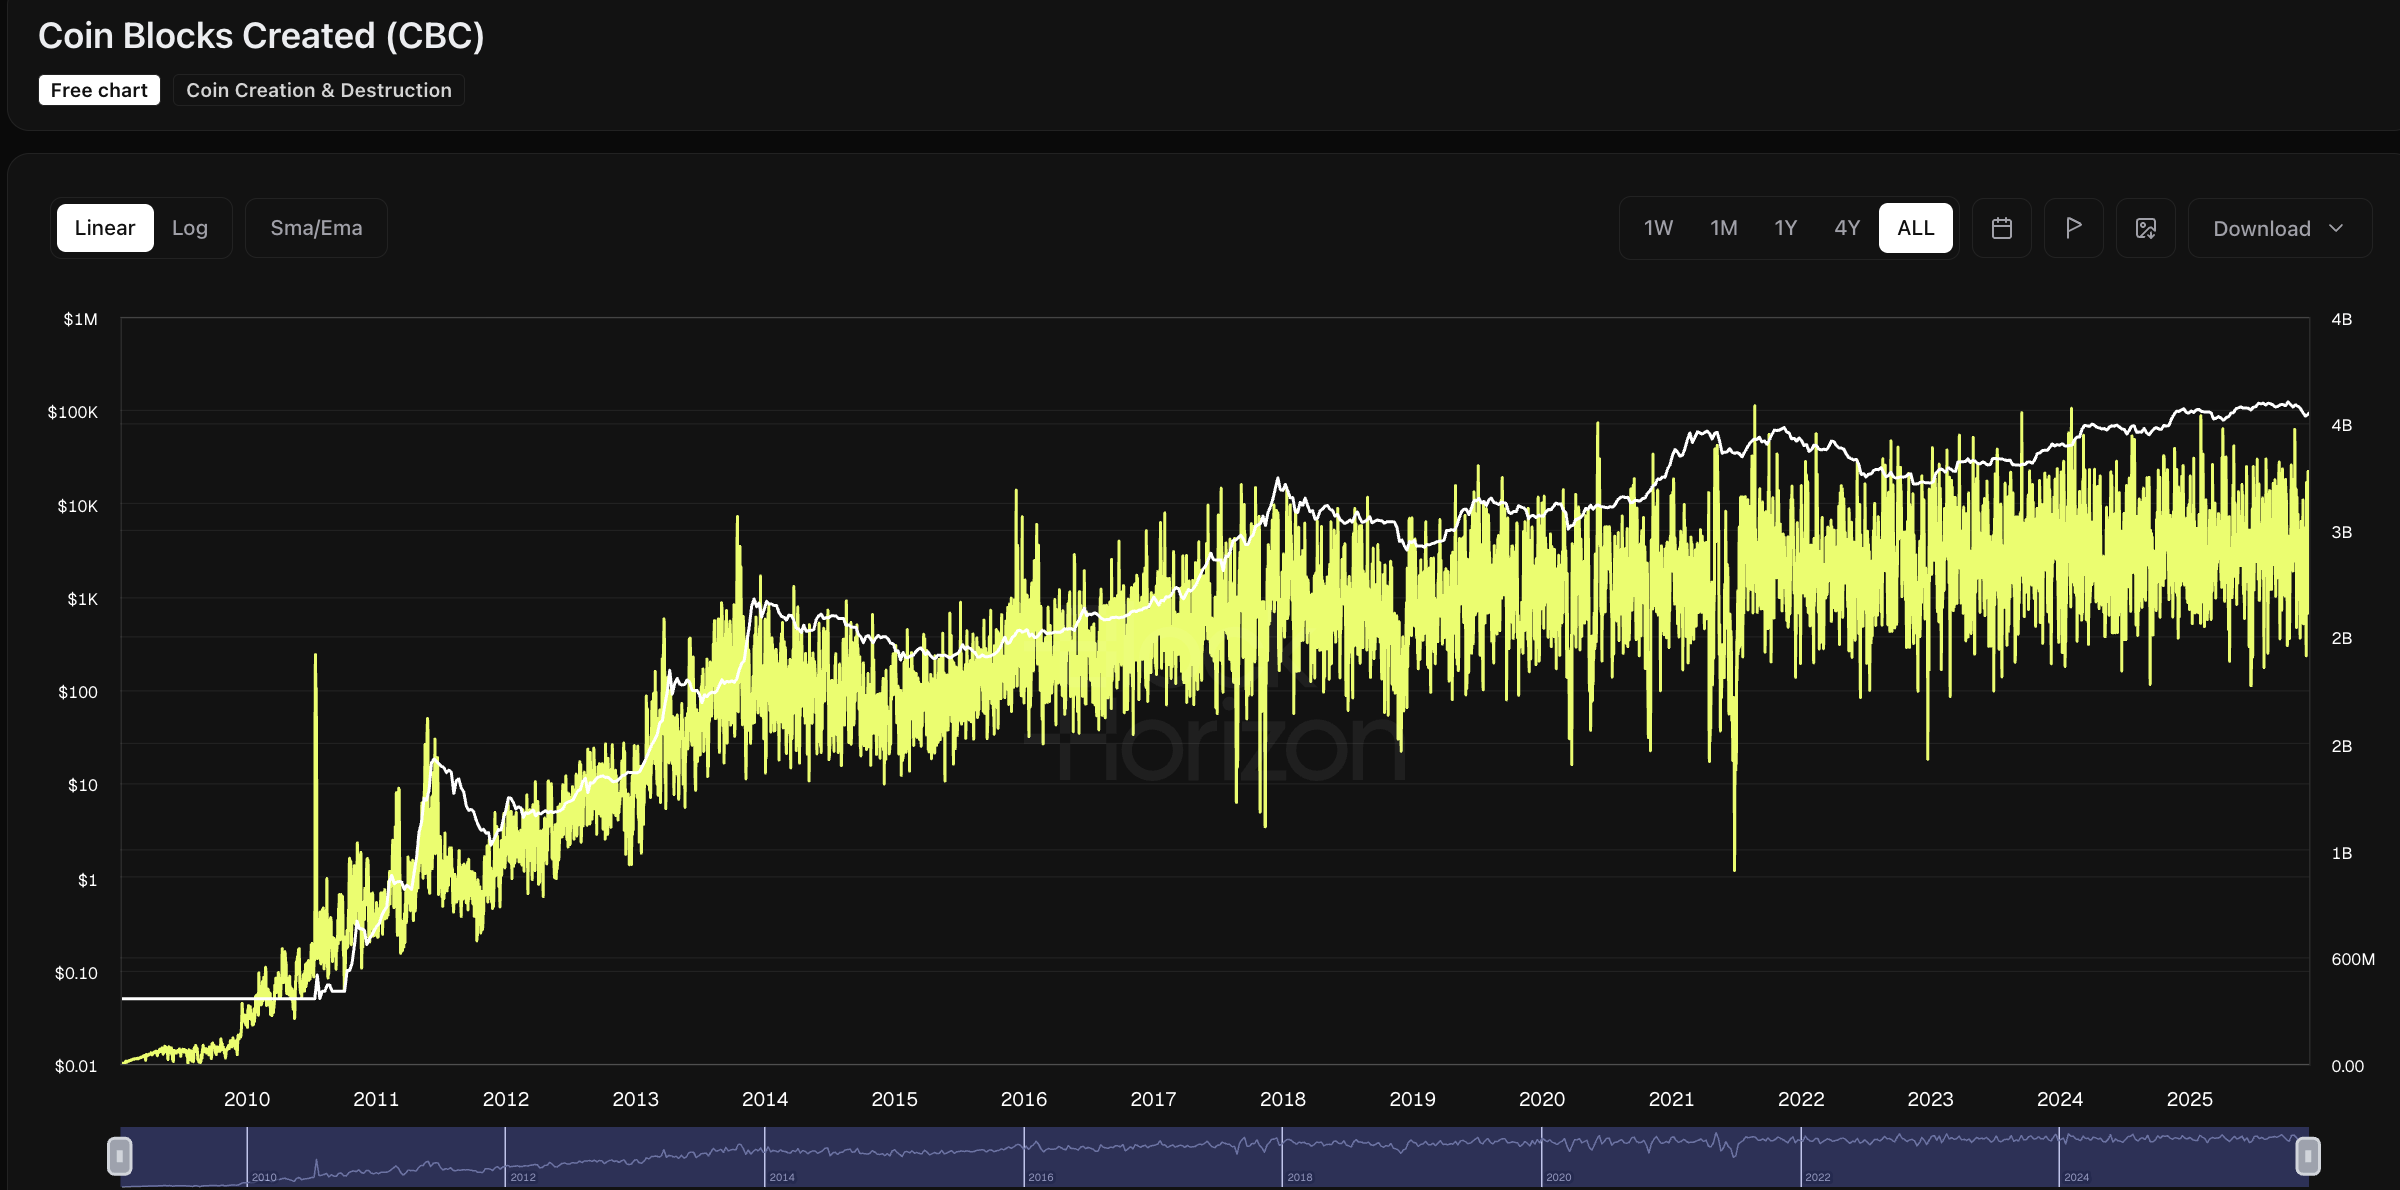
Coin Blocks Created Indicator (Chart Tutorial)
Coin Blocks Created tracks the buildup of holding activity across the Bitcoin network by showing how many new “coin blocks” were created each day. In simple terms, it tells you how much new coin age the market generated by not spending its coins.
This gives powerful insight into whether the network is collectively holding or spending—a key behavioral signal for cycle analysis.
What Are Coin Blocks? (Simple Definition)
Coin Blocks represent the amount of coin age being accumulated over time.
Formula:coin blocks = coins held × days unspent
When coins remain idle:
They generate new coin blocks every day they stay unspent.
When coins move:
All accumulated coin blocks are destroyed and reset to zero.
Why this matters
Coin Blocks visualize the accumulation of holding behavior across the entire Bitcoin network. They allow analysts to track how much coin age is being built—or erased—through market activity.
What Does “Coin Blocks Created” Measure?
This metric specifically measures:
The total newly created coin blocks during a selected timeframe
How much coin age was added due to holders not moving their coins
The rate of accumulation occurring across the entire network
Key takeaway: The higher the Coin Blocks Created → the more holders are sitting tight.
Why Coin Blocks Created Matters
Coin Blocks Created is a behavioral macro indicator. It reveals:
When holders collectively decide to hold rather than spend
Accumulation phases during bear markets
Distribution phases during rallies
Long-term holder sentiment and conviction
Because it measures holding behavior independent of price, it often gives cleaner signals than charts that rely on price-based metrics alone.
Insight: Coin Blocks Created is a powerful lens into whether the market prefers to save or spend.
How to Read the Coin Blocks Created Chart
Here’s how to interpret the chart:
High values mean:
Strong holding behavior
Supply staying dormant
Network-wide accumulation
Low values mean:
Increased spending
Redistribution
Profit-taking
Key behaviors to watch:
Multi-week trends → long-term accumulation or distribution
Sudden drops → behavioral shifts or volatility
Patterns before/after major events
Cycle transitions → accumulation → rally → distribution
What High Coin Blocks Created Means
High readings signal a strong, deliberate shift toward holding:
Many coins are remaining idle for longer
Accumulation is strong across the network
Long-term holders are increasing their conviction
Often aligns with market bottoms in bear markets
Reduces short-term sell pressure
Why it matters: High Coin Blocks Created typically precede solid price bases and healthier long-term setups.
What Low Coin Blocks Created Means
Low readings highlight active market behavior:
Spending and redistribution rise
Profit-taking increases
Short-term traders dominate
Volatility tends to increase
Potential distribution phase
Often appears near market tops, crashes, or emotional periods
Insight: Low Coin Blocks Created frequently marks the moments when holders decide to exit, rebalance, or take profits.
Understanding Holding vs Spending Behavior
The dynamic is simple but powerful:
When coins sit still → coin blocks accumulate.
When coins move → coin blocks are destroyed.
Coin Blocks Created tracks the creation side of this behavior.
This allows analysts to identify whether the network is collectively:
Saving (accumulation)
Spending (distribution)
Historical Patterns in Coin Blocks Created
Bull Markets
Lower Coin Blocks Created
Long-term holders spend into strength
Redistribution and profit-taking dominate
Bear Markets
Higher Coin Blocks Created
Holders prefer saving → inactivity → accumulation
Network-wide dormancy increases
Market Transitions
Sudden chart shifts mark turning points
Accumulation → distribution or vice versa
Behavior around high-volatility events becomes extremely visible
How Analysts & Traders Use Coin Blocks Created
This metric is used to:
Identify high-conviction accumulation periods
Spot early signs of distribution or market heating up
Confirm shifts in long-term holder sentiment
Evaluate macro trends separate from price noise
Recognize cycle turning points
Assess structural supply pressure and coin dormancy
Analysts value this metric for its objectivity—behavior can’t be faked.
Limitations of the Coin Blocks Created Indicator
It’s important to keep expectations realistic:
It doesn’t show who is holding—only aggregate behavior
Sensitive to shifts in coin-age distribution
Does not predict price direction by itself
Best used alongside CDD, ASOL, and volume metrics
High readings during low-volatility periods require context
Pro Tips for Using the Coin Blocks Created Chart
To get the most out of it:
Focus on multi-week trends, not daily noise
Study divergence between coin blocks and price
Treat sudden shifts as early behavioral signals
Use high levels to spot bottom-forming accumulation
Use low levels to identify potential distribution pressure
Frequently Asked Questions (FAQ)
1. What does Coin Blocks Created measure?
It measures how many new coin blocks (coin-age units) were generated as coins remained unspent.
2. What does high Coin Blocks Created mean?
Strong holding behavior, accumulation, and long-term confidence.
3. What does low Coin Blocks Created mean?
Increased spending, redistribution, or profit-taking.
4. How is this different from Coin Days Destroyed (CDD)?
Coin Blocks Created = creation of coin age
CDD = destruction of coin age when coins move
5. Is Coin Blocks Created a price prediction tool?
No, but it reveals sentiment shifts that often precede macro movements.
6. Why do bear markets show higher Coin Blocks Created?
Because holders prefer to accumulate and remain inactive instead of selling.
7. Can sudden drops in Coin Blocks Created signal market shifts?
Yes—these drops often reflect distribution or rising volatility.


.jpg)