Bitcoin Data
On-Chain Metrics

Blocks Mined Indicator (Chart Tutorial)

,
November 25, 2025
7 min read
Powered by Block Horizon proprietary Bitcoin datasets.

TL;DR

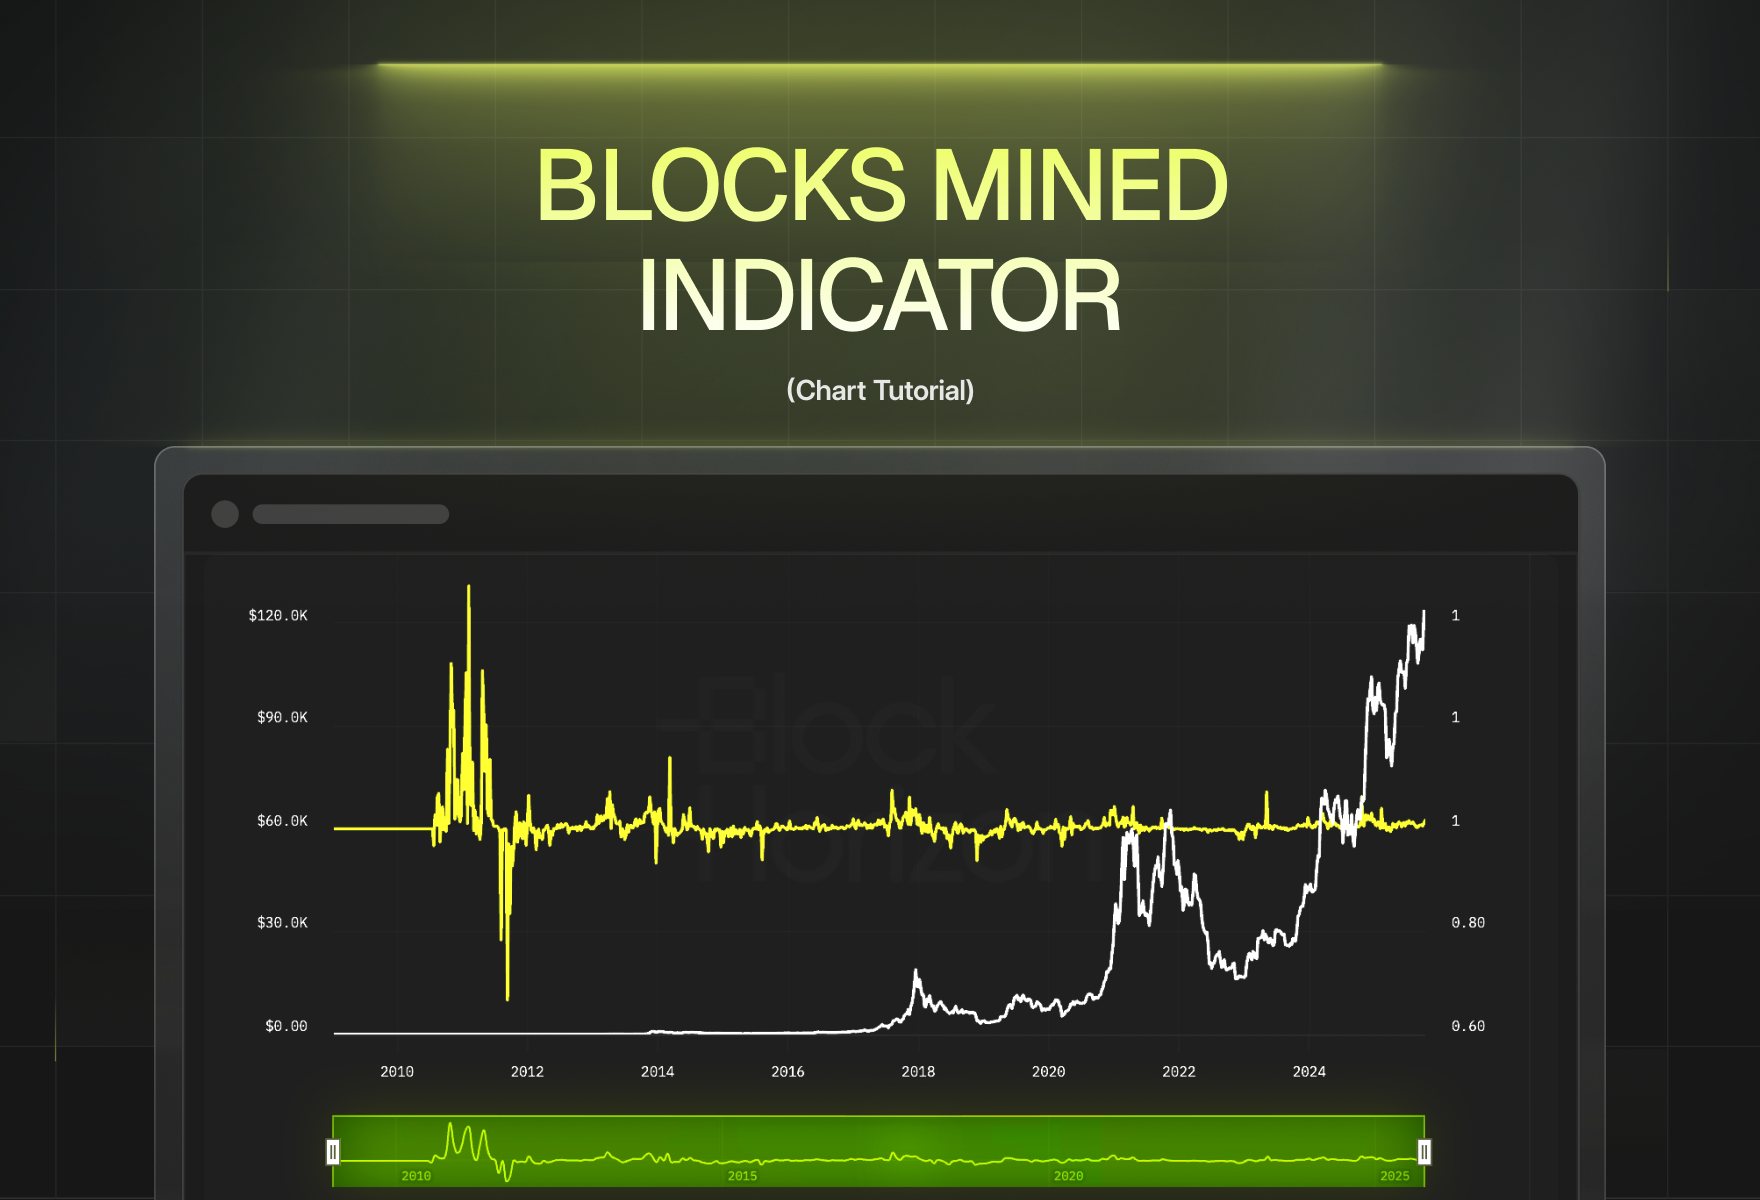
  • Blocks mined measures block production over time.
  • It reveals network health, mining participation, and difficulty shifts.
  • It’s one of the most useful metrics for halving analysis and miner behavior insights.

Bitcoin’s “blocks mined” metric looks simple at first — it’s literally the count of how many blocks miners produced over a period. But the story behind those numbers? That’s where the insights live. The Blocks Mined chart on BlockHorizon shows you whether the network is healthy, stressed, growing, or reacting to market events in real time.

If you want to understand miner behavior, network security, or the lead-up to each halving cycle, this chart is one of your best tools.

What Is the Blocks Mined Metric? (Simple Definition)

The Blocks Mined metric tracks the number of Bitcoin blocks successfully mined within a specific timeframe — daily, weekly, monthly, or custom periods.

This metric reflects:

  • How active miners are
  • How strong (or weak) network participation is
  • How quickly blocks are being discovered
  • Whether the network is operating as expected

Key points:

  • Every new block contains a fresh set of confirmed transactions.
  • A healthy Bitcoin network produces around 144 blocks per day, on average.
  • When block counts deviate from expected ranges, something important is happening — difficulty shifts, miner migrations, halvings, and more.

Blocks mined is one of those underrated metrics that tells you what’s really happening behind the scenes, especially during volatile periods.

Why Blocks Mined Matters for Bitcoin Analytics

If you care about the Bitcoin network beyond just price action, this metric becomes essential. Blocks mined is a direct proxy for how well the network is performing.

Here’s why it matters:

1. It Shows Network Uptime & Performance

If blocks are being mined consistently, Bitcoin is functioning smoothly. If block production drops sharply, Bitcoin is signaling stress.

2. It’s a Strong Indicator of Mining Participation

Higher block production → miners are very active

Lower block production → miners are exiting or struggling

It’s one of the best signals of how much hash power is online.

3. Helps Detect Short-Term Anomalies

This chart often reveals issues before they show up anywhere else:

  • Network slowdowns
  • Difficulty overshoots
  • Miner shutdowns
  • Congestion
  • Orphan block spikes

4. It Correlates With Halving Cycles and Market Activity

Blocks mined often behaves erratically around halvings:

  • Pre-halving → miners push hash power to maximize final high-reward era
  • Post-halving → older mining machines shut down
  • Difficulty then adjusts and stabilizes the network

Pretty much every halving has a signature “block production wobble” visible on this chart.

How to Read the Blocks Mined Chart on BlockHorizon

Here’s how to actually use the chart without overthinking it.

The chart displays:

  • Blocks mined per selected timeframe (daily/weekly/monthly)
  • Deviations from expected block production (~144/day)
  • Historical block production levels
  • Context for difficulty adjustments
  • How block production relates to price cycles and upcoming halving events

What to look for:

  • Sharp drops → miner exits, difficulty too high, hash rate collapse
  • Sharp spikes → new hardware online, hash rate surges, pre-halving boosts
  • Steady flat patterns → network equilibrium (healthy)

If you use this chart while watching difficulty, block times, and hash rate together, it becomes one of the most powerful real-time signals on BlockHorizon.

What a High Blocks Mined Rate Means

When blocks mined exceed expected levels, something interesting is happening. Bitcoin aims for ~10-minute blocks, but hash power doesn’t always cooperate.

Indicators of high block production:

  • Strong mining participation. New miners or new hardware is coming online.
  • Hash rate is rising. More computing power leads to shorter block times (until difficulty catches up).
  • Good mining economics. Higher fees + block rewards = miners expand operations.
  • Temporary acceleration pre-difficulty adjustment. Blocks come in faster until difficulty retargets.

Why this matters:

High block production usually indicates:

  • Network security is strong
  • Miners are profitable
  • Mining investment is rising
  • Upgrades in ASIC technology are hitting the market
  • Pre-halving miner expansions are in full swing

You see this every time a new generation of mining machines drops — blocks temporarily speed up until difficulty resets.

What a Low Blocks Mined Rate Means

This is where analysts start paying closer attention. Consistently low block production levels indicate stress in the mining ecosystem.

Possible causes:

  • Miner capitulation. When Bitcoin price drops, weaker miners shut down.
  • Hash rate collapse. Regional bans, blackouts, or migration can remove large chunks of hash power.
  • Difficulty too high. After big hash rate drops, difficulty can lag behind.

  • Network upgrades or forks. Major consensus changes sometimes disrupt block flow temporarily.
  • Congestion reducing throughput. Extreme mempool pressure impacts propagation and stability.
  • Low mining incentives. Low fees + lower rewards (post-halving) = unprofitable conditions.

Red flags to watch for:

  • Multiple consecutive days under 128 blocks/day
  • Block intervals stretching beyond 15–20 minutes
  • Rising number of orphan blocks
  • Reorganizations or chain instability
  • Difficulty failing to adjust properly

These events are rare — but when they happen, they’re loud.

Understanding Expected Blocks Per Day

Bitcoin’s entire mining system is built around one simple expectation:

~144 blocks per day

That number comes from:

  • 10-minute average block time
  • 24 hours per day
  • 6 blocks per hour
  • 6 × 24 = 144

Anything above or below this signals:

  • Hash rate changes
  • Difficulty mismatches
  • Rapid miner migrations
  • Changes in mining profitability
  • External shocks (regulatory, energy, climate, hardware)

Important notes:

  • Difficulty adjusts only every 2016 blocks (~2 weeks).
  • Between adjustments, block production always fluctuates.
  • Minor deviations are normal.
  • Extreme deviations are where the insights live.

If you can learn to read these patterns, you’ll understand Bitcoin’s mining cycles better than 99% of traders.

Blocks Mined & Bitcoin Difficulty Adjustments

This is one of the most important relationships in Bitcoin analytics.

Difficulty controls how fast blocks are mined.

  • If hash rate rises → blocks mined rises → difficulty increases to slow block discovery.
  • If hash rate falls → blocks mined falls → difficulty decreases to speed block discovery.

This push-and-pull keeps Bitcoin stable over long periods.

How to analyze this on BlockHorizon:

  • Compare dips in blocks mined to the Difficulty Indicator.
  • Identify periods of miner capitulation.
  • Spot sudden stress after halvings.
  • Look for irregular difficulty swings that may signal major miner migrations.

If the Blocks Mined chart and the Difficulty chart disagree sharply, the network is telling you something big.

How Halving Events Affect Blocks Mined

Every halving leaves a fingerprint on this chart. Every single one.

Before the halving:

  • Miners push hardware online
  • Hash rate rises
  • Blocks mined rise
  • Competition explodes
  • Block times temporarily speed up

“Make as much BTC as possible before the reward cuts in half” — that’s the miner mindset.

Immediately after the halving:

  • Block rewards drop 50%
  • Some miners shut machines off
  • Blocks mined drops
  • Block times slow
  • First difficulty adjustment stabilizes the system

This is why the weeks after a halving are some of the most interesting periods in Bitcoin’s history.

Why this chart is valuable:

The Blocks Mined chart is your best tool to:

  • Track miner sentiment around reward cuts
  • Predict post-halving stabilization
  • Measure how resilient miners are
  • Understand the energy economics of Bitcoin

Historical Patterns & Major Insights

Let’s highlight some major block-production moments that shaped Bitcoin’s history:

2017 Bull Run → Hash Power Expansion

Miners all over the world added machines to capture rising profits. Blocks mined rose + block times sped up.

2018 Miner Capitulation → Sharp Drop

When Bitcoin price collapsed, weaker miners couldn’t afford electricity. Block production fell hard until difficulty adjusted.

2020 Halving → Temporary Instability

Many older mining rigs shut off instantly at the halving block. Block times slowed until difficulty corrected.

2021–2022 China Mining Ban → Largest Hash Rate Drop in History

This was the most dramatic collapse ever recorded: ~50% of global hash power vanished overnight.

The Blocks Mined chart went into freefall until miners relocated globally.

2024 Halving → A New Era of Miner Resilience

Despite the reward drop, block production stabilized faster than previous cycles. Energy efficiency and global decentralization played major roles.

These events are always visible in the blocks mined metric — often before price reacts.

How Traders, Analysts & Creators Use the Blocks Mined Metric

This is not just a “mining geek” metric. It’s one of the most practical tools for anyone studying the Bitcoin network.

Real-world uses:

  • Track mining bull/bear phases
  • Identify capitulation risk
  • Detect network anomalies early
  • Predict difficulty adjustments
  • Validate surges in on-chain activity
  • Map mining cycles to price cycles
  • Monitor miner profitability
  • Confirm network decentralization strength
  • Understand energy-market trends

If you’re analyzing Bitcoin seriously, you’ll be referencing this chart constantly.

Limitations of the Blocks Mined Metric

To build trust with readers, this part matters.

Blocks mined is extremely useful — but not complete on its own.

It does NOT tell you:

  • Why blocks increased or decreased
  • Whether miners are profitable
  • Whether fees spiked
  • What transactions are inside the blocks
  • Whether hash rate is rising or falling
  • What the mempool is doing

You must combine it with:

  • Hash rate
  • Difficulty
  • Mempool data
  • Fees
  • Transaction volume
  • Miner revenue metrics

Short-term noise also happens — hour-by-hour swings are normal.

Blocks mined becomes powerful when you zoom out and compare patterns across multiple cycles.

Pro Tips for Using the Blocks Mined Chart on BlockHorizon

A few battle-tested ways to extract maximum insight:

  • Always compare daily block counts to the expected 144/day.
  • Watch real-time numbers during halving years — this is when patterns are clearest.
  • Look for multi-day divergences from difficulty.
  • Track pre-difficulty-adjustment hash rate surges.
  • Combine with miner revenue metrics to gauge profitability.

  • Analyze block time variance alongside blocks mined.
  • Use weekly and monthly views to detect long-term mining cycles.

Frequently Asked Questions

1. What does “blocks mined” mean in Bitcoin?

It’s the number of new blocks miners successfully added to the blockchain within a given period.

2. How many Bitcoin blocks are mined per day?

Roughly 144 per day, based on the 10-minute block target.

3. Why would blocks mined suddenly drop?

Common causes include miner shutdowns, difficulty mismatches, hash rate crashes, or major network events.

4. How does mining difficulty affect blocks mined?

Higher difficulty → slower block production

Lower difficulty → faster block production

Difficulty adjusts every 2016 blocks to stabilize the network.

5. Do halvings change how fast blocks are mined?

Yes, temporarily. After block rewards are cut, some miners shut off, slowing block production until difficulty adjusts.

6. What happens when block production slows down?

Block times lengthen, mempool pressure rises, and the next difficulty adjustment compensates.

7. Does blocks mined influence Bitcoin price?

Indirectly. Blocks mined reflects mining economics and network health, which often correlate with market cycles.

View real-time Blocks Mined data → Sign up to access full dashboard

Check the live Blocks Mined chart to stay ahead of miner behavior, halving cycles, and network health trends.

Your dashboard gives you the full picture — in real time.

About author
,
Back to top

Build with BlockHorizon

Get started with BlockHorizon today and unlock the
full power of the Bitcoin Blockchain
Talk to our team