

.jpg)

Build with BlockHorizon
Get started with BlockHorizon today and unlock the
full power of the Bitcoin Blockchain
full power of the Bitcoin Blockchain
Talk to our team


If you hang around Bitcoin long enough, you’ll hear people casually throw out numbers like, “We’re approaching block 840,000” as if it’s some secret language. And honestly… it is. But once you understand block height, everything about the Bitcoin network becomes clearer — network health, mining participation, halving timing, even chain stability.
Block height is one of the simplest metrics in Bitcoin, but also one of the most misunderstood. It’s literally just a number, yet it tells you exactly where Bitcoin is in its lifecycle. It’s the odometer for the entire network.
And in this guide, we’re going to break it down without boring you to death. Promise.
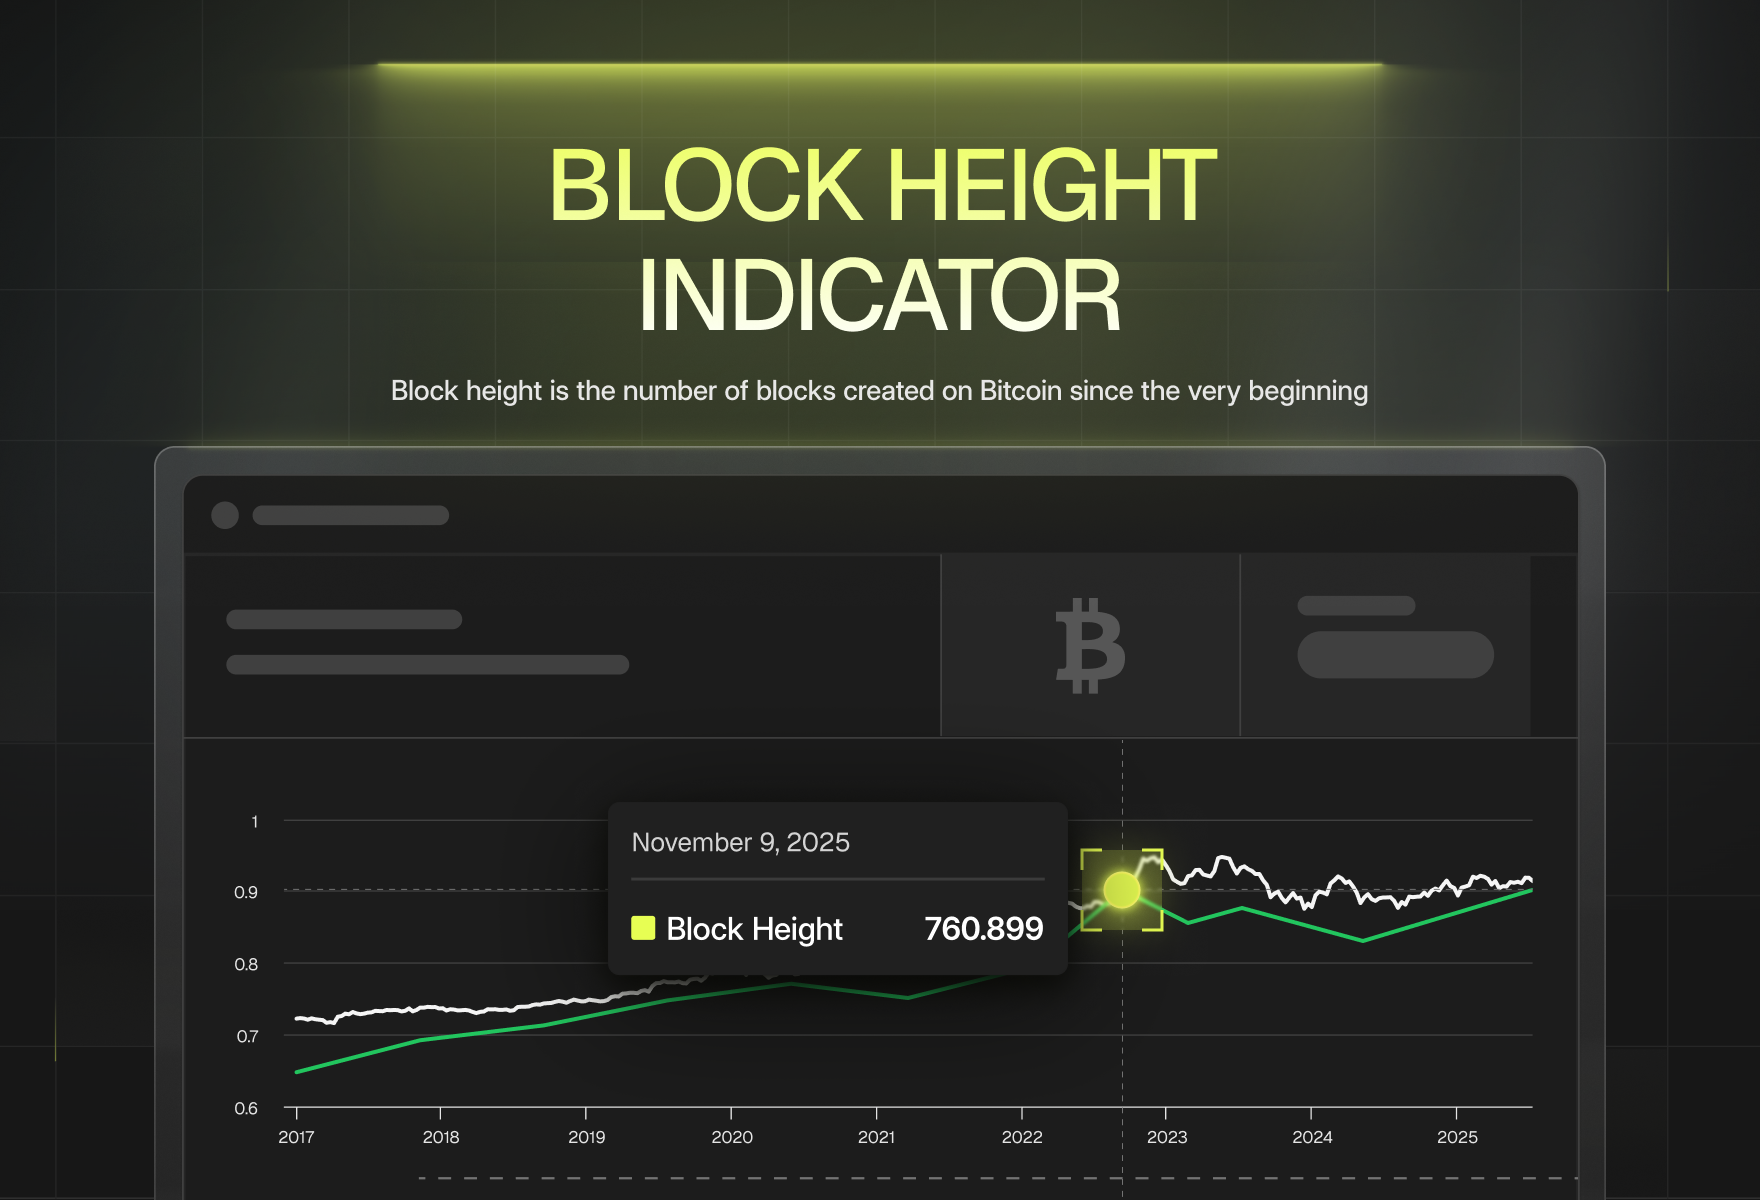
Block height is the number of blocks created on Bitcoin since the very beginning — the Genesis Block.
Think of it like Bitcoin’s version of page numbers. Block 0 was created by Satoshi in 2009. Every time miners successfully add a new block, the number increases by one.
Today Bitcoin has hundreds of thousands of these blocks stacked on top of each other, forming an unbroken chain of history.
Bitcoin doesn’t trust timestamps (and you shouldn’t either). Timestamps can be manipulated by miners, hardware clocks drift, and timezones make everything messy. So instead of tracking time, Bitcoin tracks progress.
Every new block = +1 block height. It’s clean. It’s deterministic. It can’t be faked.
Because miners must follow consensus rules, the block height tells every node exactly where they are in the chain. There’s no arguing with it, no timezone issues, no ambiguity. Block height is the authoritative way to measure:
A timestamp might lie. Block height never does.
If Bitcoin produces a new block, block height goes up by exactly one. If Bitcoin stops producing blocks, block height freezes.
Simple. Powerful.
You might think block height is just a technical detail — a number nerds argue about on X. But it’s actually a core metric that gives you a quick read on the entire network’s vitality.
Here’s what it tells you:
Block height is the most accurate way to measure Bitcoin’s lifespan. You’re literally counting every chapter the network has added over time.
Bitcoin has been online for over 15 years with virtually no downtime. If block height stops increasing for too long, something serious is happening.
A healthy network = block height steadily climbing.
More miners → faster block discovery (until difficulty adjusts). Fewer miners → slower block discovery.
Large shifts in block height growth rate often indicate:
Rapid or slow changes in block height can be early signals of:
If you know how to read block height, you can spot weirdness before it hits the headlines.
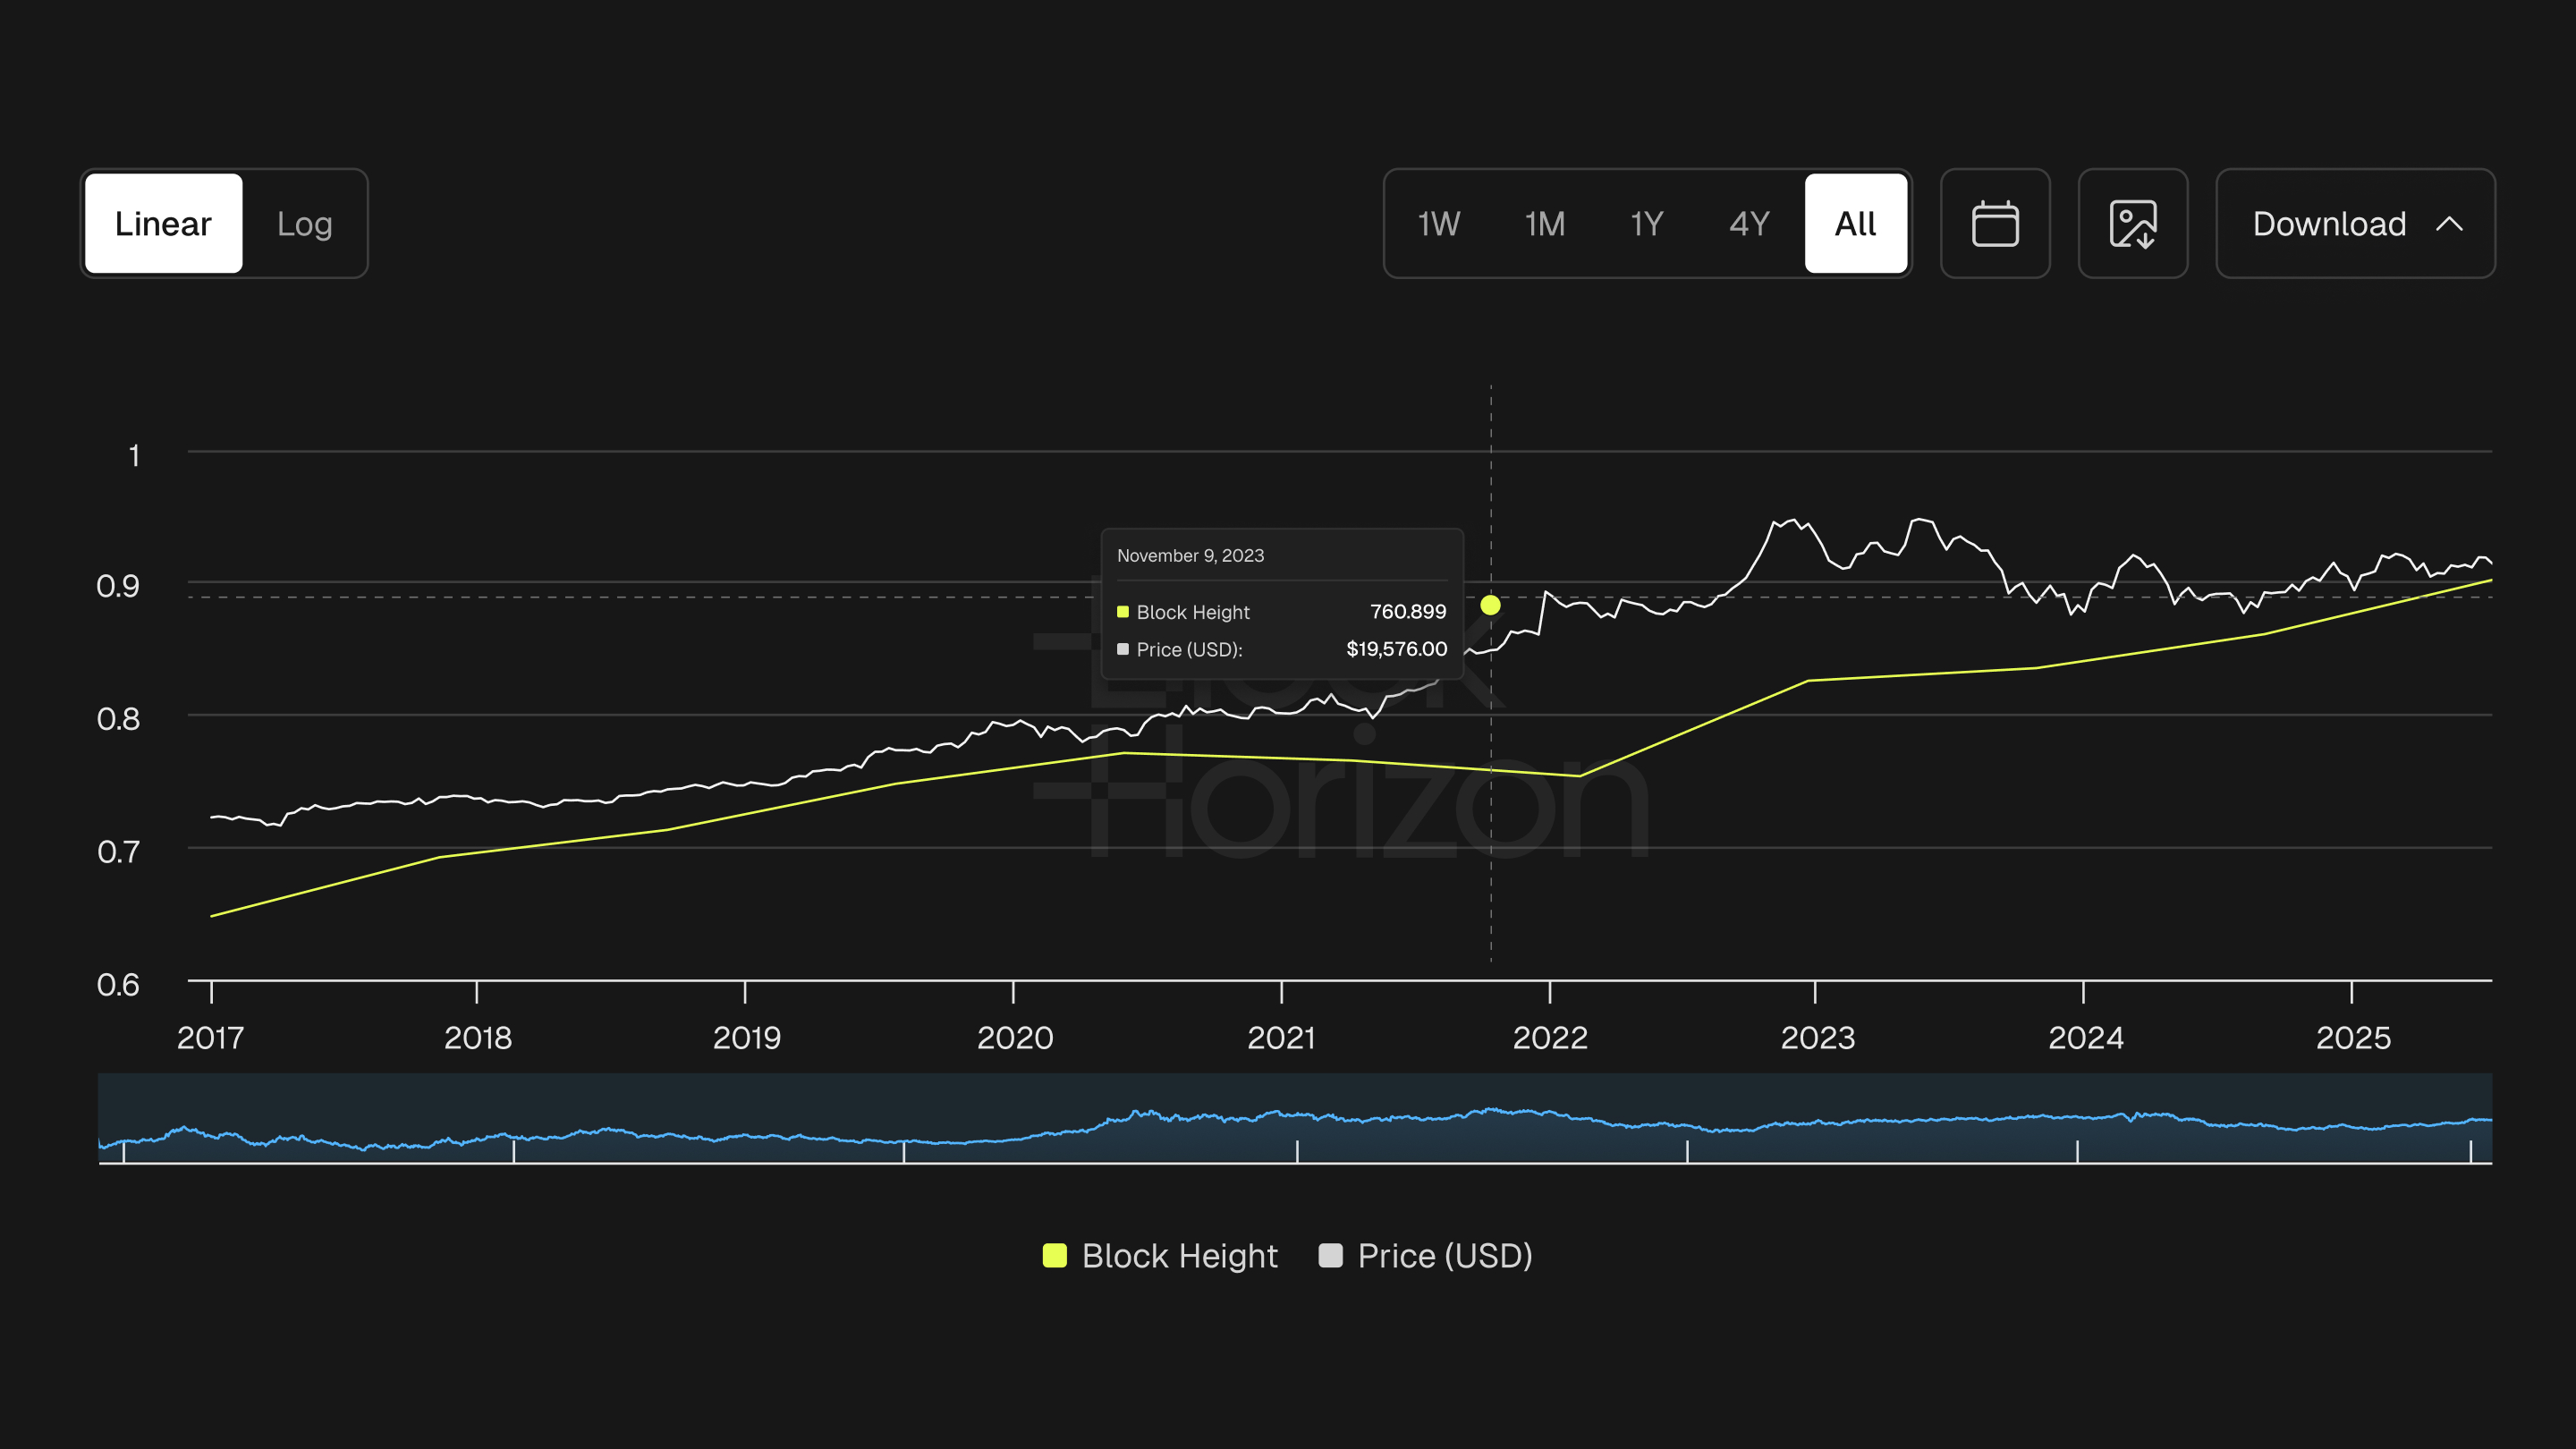
The block height chart is designed to make Bitcoin’s block progression easy to interpret without requiring a real-time feed. Instead of focusing on individual block arrivals, it emphasizes trends and patterns that matter for analysis. Here’s what to pay attention to:
Bitcoin aims for a new block roughly every 10 minutes, but block production is probabilistic - not guaranteed. Actual intervals vary widely, with some blocks arriving seconds apart and others taking 20+ minutes. The chart helps you understand these fluctuations without relying on exact block-by-block updates.
When block intervals speed up or slow down noticeably, it often signals changes in mining conditions.
These pacing trends help you understand how hash power and difficulty interact.
Occasionally, you’ll see periods of unusually fast block production or extended pauses. These deviations can reflect:
These aren’t necessarily problems, they’re just part of how the network naturally behaves.
To interpret pacing patterns more clearly, it helps to view block height alongside other Bitcoin metrics such as:
Together, these metrics give a more complete view of network conditions and mining dynamics.
When blocks are flying in faster than usual, here’s what it typically signals:
Bitcoin is probabilistic, so short-term streaks are normal. Pay attention to patterns over hours or days.
This is where you grab a coffee and open BlockHorizon. Slow block production isn’t always a crisis — but it’s always interesting.
Here are the most common explanations:
Miners shut machines off when:
Fewer miners → slower blocks.
Difficulty only adjusts every 2016 blocks (~2 weeks). So if hash rate suddenly drops, Bitcoin becomes “too hard” temporarily, slowing block discovery.
Counterintuitively, heavy congestion can sometimes lead to:
Miners pack blocks strategically when fees spike, sometimes impacting cadence.
Rare, but possible. This includes:
Bitcoin has had only a handful of confirmed irregular downtime moments in 15+ years. But if block height freezes for too long, it’s worth paying attention.
Here’s where block height becomes a superstar metric.
Bitcoin halvings never happen by date. They happen at exact block heights.
That’s why every trader, analyst, miner, and maxi follows block height like hawks during halving years.
Every halving cuts block rewards in half → dramatically slowing new Bitcoin supply. Supply shocks often lead to volatility, speculative cycles, and long-term price trends.
Because height increases deterministically, you can count down to halving with extreme accuracy. This is why BlockHorizon’s “Days Until Halving” chart is one of the most reliable countdown tools.
A lot of beginners confuse these two terms. Don’t.
Think: “What chapter of the Bitcoin story are we in?”
Think: “How fast are miners adding new chapters?”
Because:
When you combine height, block time, and difficulty, you understand the real health of the network.
Here are some of the most iconic moments in Bitcoin’s block height history:
Your dashboard tracks all upcoming halving-related milestones automatically — no guesswork required.
Block height isn’t just a number for developers. Traders, miners, and analysts rely on it daily. Here’s how:
Every halving has historically triggered volatility before and after the event. Block height gives traders a precise countdown.
When block height speed deviates from the norm, miners are either powering up or shutting down.
Long-term block height history tells a clean story of trends:
Upgrades like SegWit or Taproot activate at specific block heights, not timestamps.
Analysts often match:
…to understand Bitcoin’s repeated patterns.
Let’s be honest — block height is powerful, but it’s not perfect. It doesn’t tell you:
That’s why professional analysts never look at block height alone.
You always pair it with:
This gives you the full story.
To get the most insight out of block height data, focus on the patterns behind block production rather than individual block arrivals:
With time, these trends become intuitive - and you’ll start spotting signals that most traders overlook.
It’s the total number of blocks added to the Bitcoin blockchain since the Genesis Block.
You can view the live block height on BlockHorizon’s real-time chart or any Bitcoin node explorer.
It shows the network’s progress, helps track halving cycles, and acts as a measure of chain continuity.
That’s the 2024 Bitcoin halving — where rewards dropped from 6.25 BTC to 3.125 BTC.
Bitcoin’s block height increases roughly every 10 minutes on average, though actual block times vary.
Halvings always occur at fixed block heights, not on specific dates.
Indirectly — halving cycles tied to block height can impact supply dynamics and investor sentiment.
Block height is Bitcoin’s natural chronological index — the count of every block mined since the Genesis Block. It helps analysts measure network activity, track halving cycles, spot anomalies, and understand mining participation.
If you want to analyze Bitcoin properly, block height is the backbone metric that ties everything together. And BlockHorizon gives you a clean, fast, real-time view of it — backed by related charts like difficulty, blocks mined, and halving countdowns.
See the real-time block height chart on BlockHorizon and start exploring the data traders use to understand network health, halving cycles, and mining activity.