

.jpg)

Build with BlockHorizon
Get started with BlockHorizon today and unlock the
full power of the Bitcoin Blockchain
full power of the Bitcoin Blockchain
Talk to our team


Bitcoin has patterns. Not perfect ones - not the kind you can trade with military precision - but emotional patterns that show up in every single cycle.
And whether you’re a long-term investor or someone just trying to make sense of Bitcoin’s behavior, one metric cuts through the noise better than almost anything else: NUPL: Net Unrealized Profit/Loss.
If you’ve ever wondered why Bitcoin feels euphoric at the top, hopeless at the bottom, confused in the middle, and oddly predictable across multi-year cycles, NUPL explains all of it. It turns on-chain cost basis into a readable sentiment map of the entire network.
And here’s why it matters:
You can’t understand Bitcoin’s macro cycles without understanding how profitable (or unprofitable) its holders are. Because profitability shapes psychology. And psychology shapes behavior.
NUPL is the closest thing we have to a real-time X-ray of market sentiment - grounded in actual blockchain data, not vibes on social media.
NUPL is calculated using one simple formula:
(Market Value – Realized Value) / Market Value
Realized value is the price each coin last moved on-chain. Market value is today’s price.
When the market is worth far more than holders’ realized cost basis, NUPL becomes highly positive. When the market is worth less than those cost bases, NUPL turns negative.
This gives you a real-time reading of something price alone can’t show you:
How people feel about their Bitcoin.
Because whether we like it or not, investors act differently when they’re deep in profit versus deep in loss.
NUPL makes that behavior visible.
Price charts can tell you where Bitcoin is. NUPL tells you why it’s behaving that way.
Unlike RSI, MACD, or pattern recognition, NUPL is grounded in actual economic data. It measures the financial position of holders - not guesswork about momentum.
Here’s why analysts lean on NUPL for macro insight:
No metric is perfect, but NUPL is one of the few that has aligned with every major euphoric peak and every major capitulation zone.
Humans are predictable during extremes. Unrealized profit breeds greed. Unrealized loss breeds despair. NUPL quantifies that.
A rising NUPL in early-cycle conditions is healthy.
A rising NUPL in late-cycle conditions is a warning.
Not opinions.
Not narratives.
Not technical drawings.
Actual cost-basis information from millions of coins.
In short: NUPL is a sentiment × valuation hybrid - and that’s why it works.
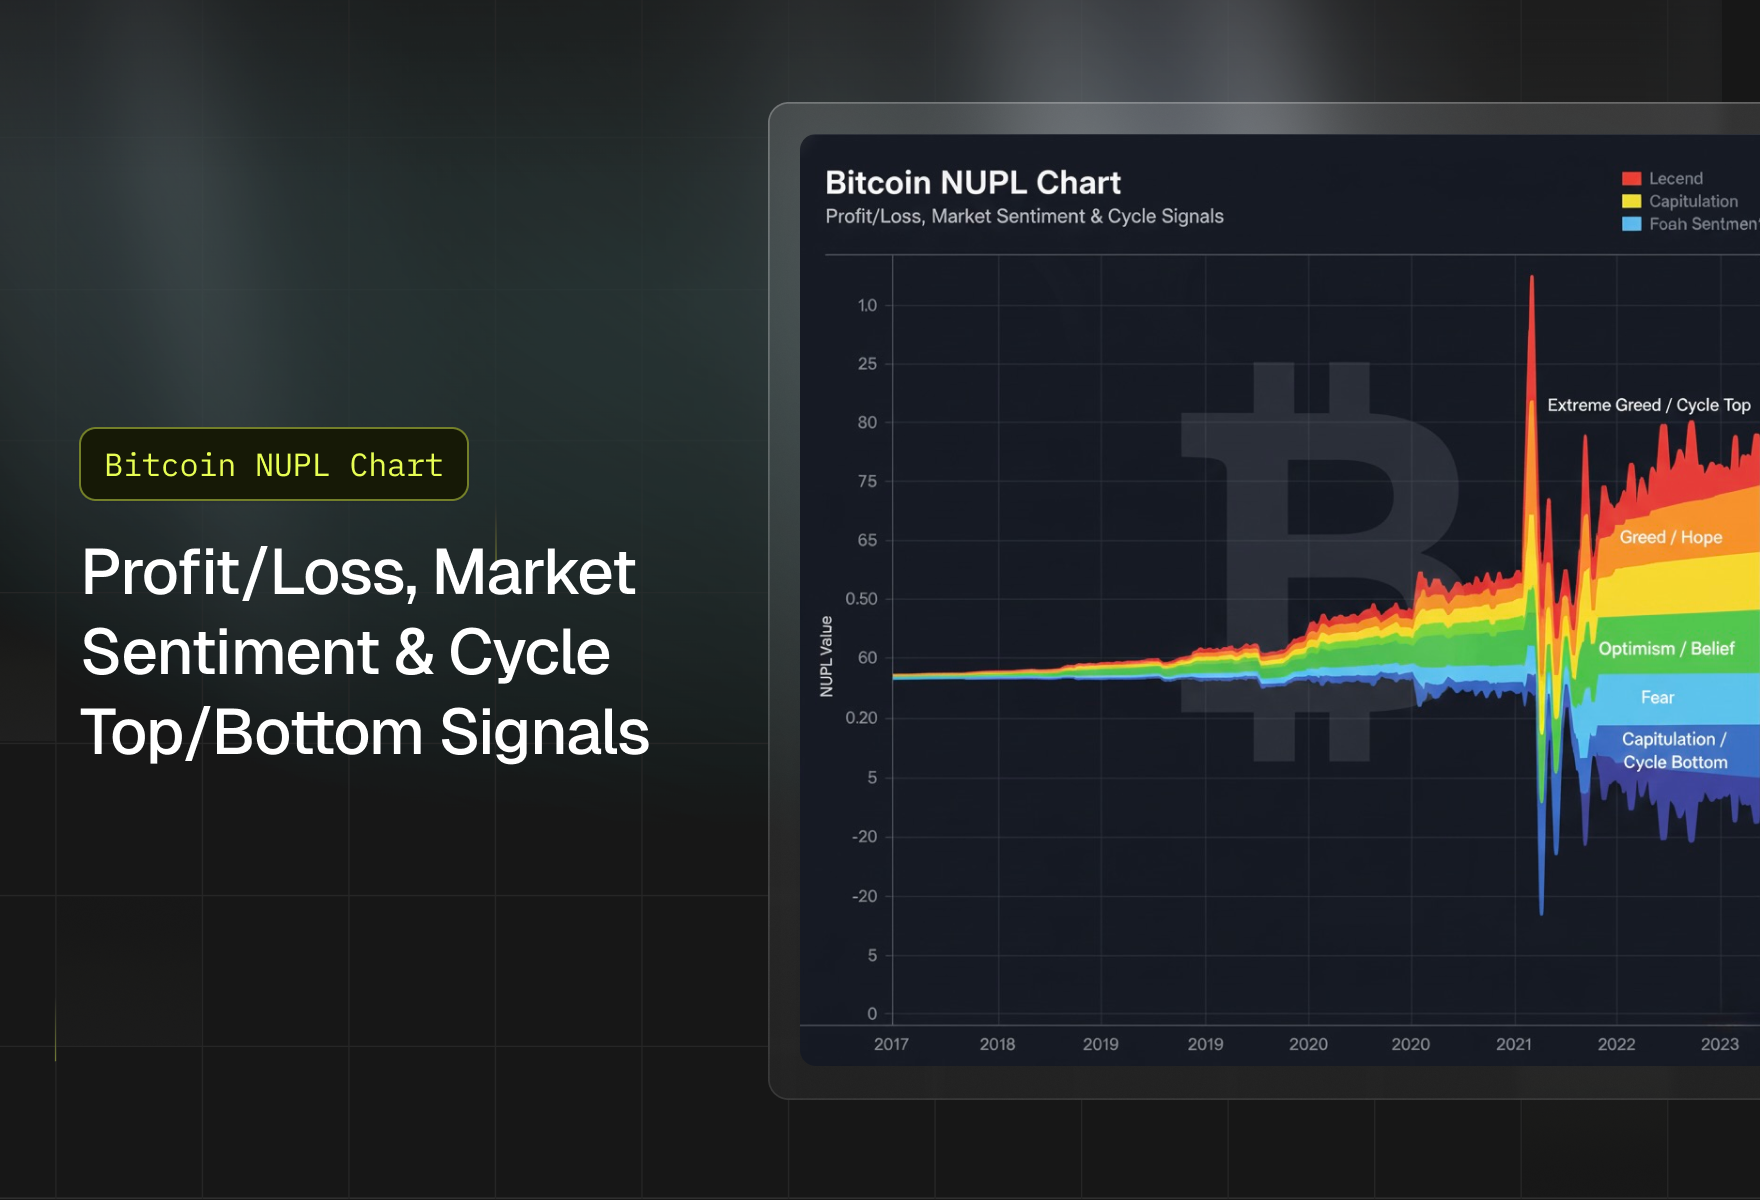
When you open the NUPL chart on BlockHorizon, you’ll see a profitability curve moving through colored zones that reflect emotional stages of the market.
Here’s the simplest way to read it:
Confidence increases, speculation rises, and greed starts guiding decisions.
This environment produced every Bitcoin top so far.
Fear and capitulation dominate.
This is where price stabilizes and long-term accumulation takes place.
Hope, disbelief, optimism, anxiety.
These ranges often mark early recovery or consolidation.
It’s not complicated - it’s consistent.
Each zone reflects a stage of Bitcoin’s emotional cycle:
Everyone feels like a genius.
Risk is invisible.
Narratives turn extreme.
These zones mark every macro top.
The trend is clearly up, but not overheated.
People insist “it’s still early.”
Mixed emotions.
Some think the bull is starting; others think it’s fake.
Accumulators quietly reappear as selling slows.
Despair, exhaustion, fear.
Ironically, the most historically profitable buying zone.
You can think of NUPL as the emotional barometer for the entire network.
Bitcoin changes over time, but human behavior doesn’t. NUPL reflects that beautifully.
Across every cycle:
Even unusual moments - like the 2021 double top - are visible through NUPL’s structure. Profit-taking peaks appear. Exhaustion signals appear. Divergence appears.
The metric doesn’t predict the future, but it does reveal where the crowd stands emotionally, and Bitcoin’s price has always followed sentiment.
Professionals don’t use NUPL to guess exact tops or bottoms.
They use it to understand risk.
Here’s how NUPL fits into real analysis:
When unrealized profits hit extreme levels and begin to flatten, risk skyrockets.
Negative NUPL + low volatility + exhausted selling = repeated bottom structures.
Are holders confident, fearful, greedy, or numb? NUPL makes this visible.
Low NUPL signals low risk; believers step in quietly.
Combined with SOPR, MVRV, Realized Price, and URPD, NUPL becomes even stronger.
Analysts don’t treat NUPL as magic.
They treat it as a compass.
High NUPL doesn’t automatically mean “sell.”
It means risk is increasing.
Unrealized profit builds pressure. At some point, holders start taking that profit - especially when leverage rises. Historically, when NUPL enters the highest bands and begins stalling, cycle tops emerge shortly after.
A healthy bull market can sustain high NUPL for months - but it never lasts forever.
If high NUPL signals risk, low NUPL signals opportunity.
When NUPL goes negative:
You won’t feel good during these periods. That’s exactly why they matter.
A few simple principles go a long way:
Deep euphoria and deep capitulation zones repeat every cycle.
NUPL isn’t predictive, but its patterns rhyme.
When price reclaims Realized Price with rising NUPL, recoveries often stick.
Profit-taking pressure shows up here before price reacts.
It’s powerful, but it’s even better when combined with other metrics.
NUPL has boundaries:
Despite these limits, it remains one of the clearest macro signals in on-chain analytics.
These insights come from analysts who monitor NUPL constantly:
The unrealized profit or loss across the Bitcoin network.
Most coins are in profit, usually bullish sentiment.
Most coins are underwater, historically bottoming conditions.
Not perfectly, but it aligns closely with both.
NUPL focuses on sentiment; MVRV focuses on valuation.
Macro cycles (months to years).
Yes, particularly during strong bull or bear trends.