This metric is ideal for macro cycle analysis, holder behavior tracking, and structural market shifts, without short-term volatility.
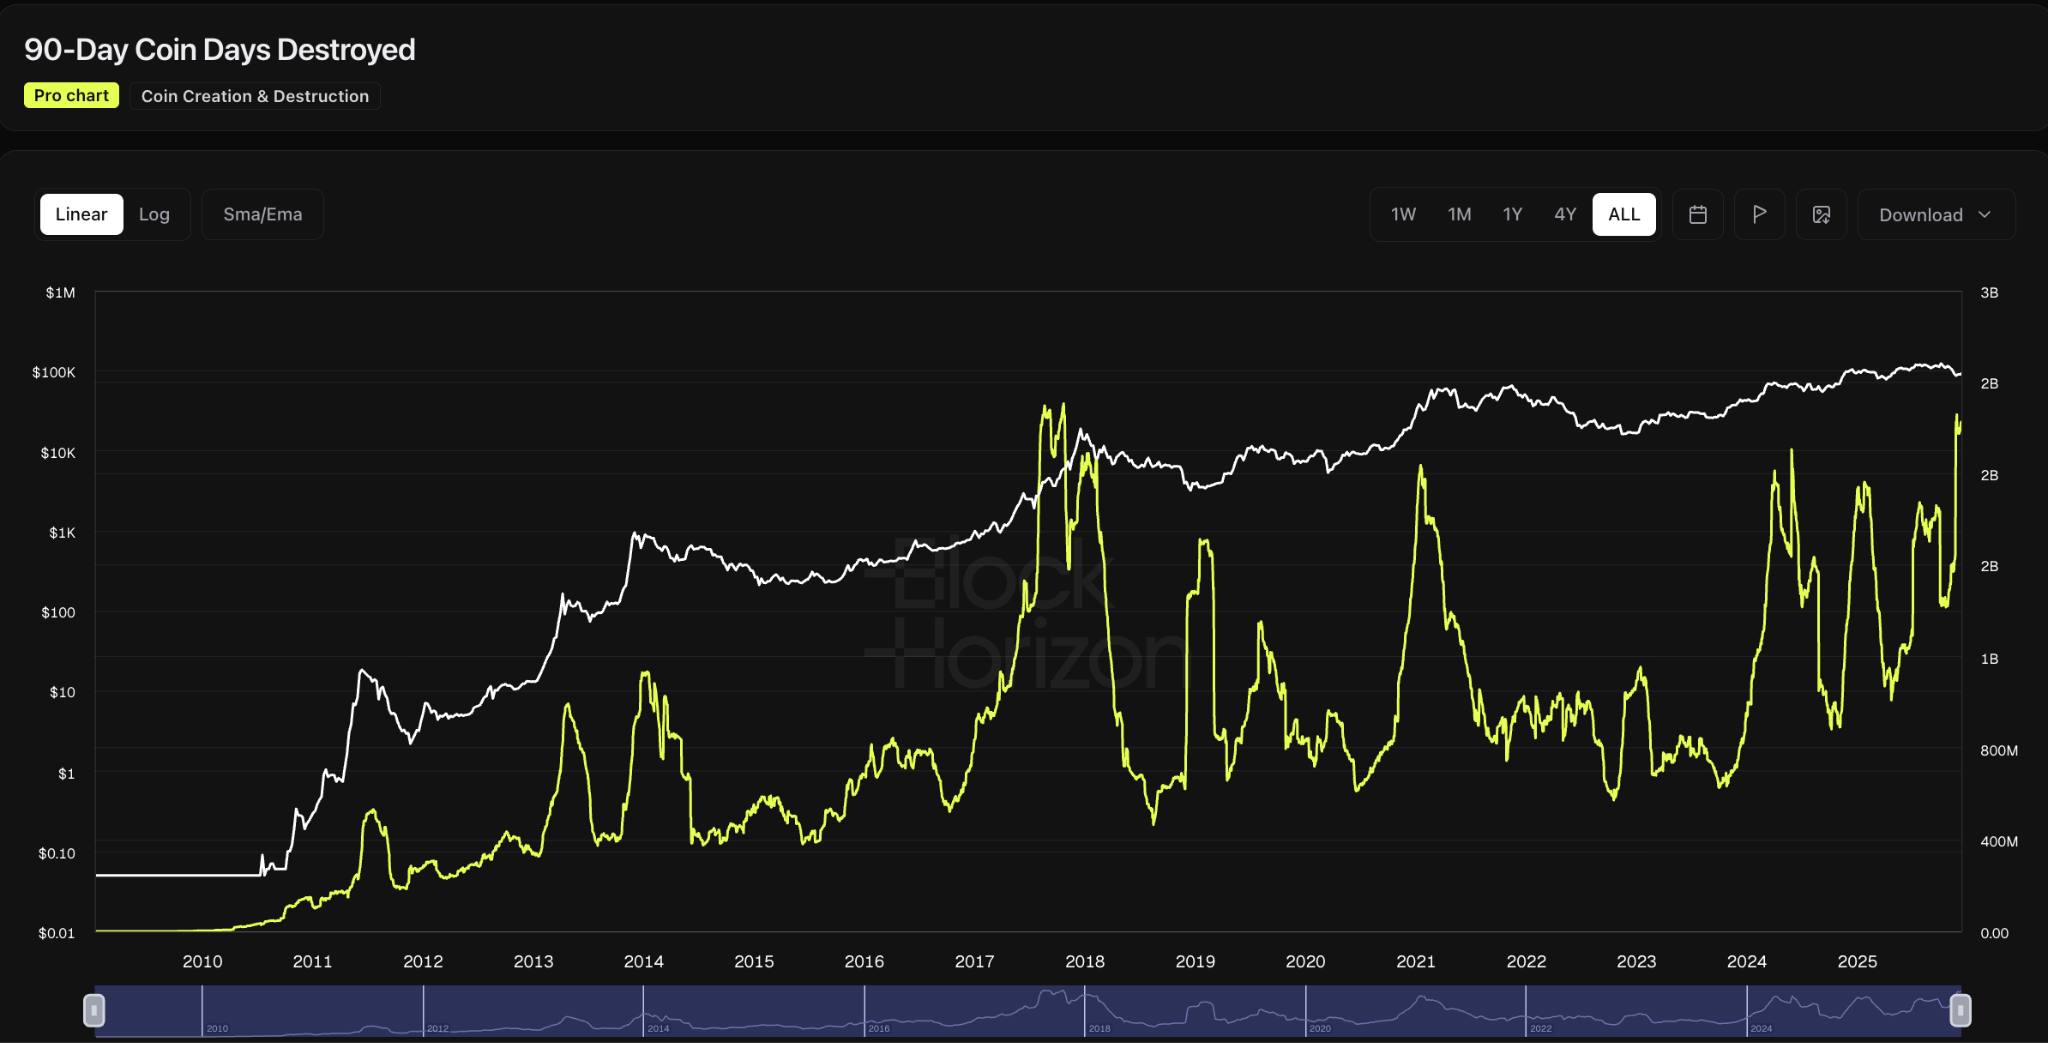
90D Coin Days Destroyed Indicator (Chart Tutorial)
The 90D Coin Days Destroyed (CDD) indicator is a smoothed version of the traditional Coin Days Destroyed metric, designed to highlight long-term holder behavior and market cycle transitions.
While daily CDD can be noisy and reactive to short-term movements, the 90-day rolling version filters out this noise and surfaces structural supply dynamics driven by older coins entering circulation.
As a result, 90D CDD is particularly useful for identifying macro shifts that are not immediately visible in price action.
What Is 90D CDD? (Simple Definition)
To understand 90D CDD, it helps to start with the fundamentals.
Coin Days
Coin Days = coins × days unspent
Coin Days Destroyed
When coins move, their accumulated coin age is erased
Older coins destroy significantly more coin days when spent
90D Coin Days Destroyed
90D CDD aggregates all coin days destroyed over a rolling 90-day window
Each data point reflects three months of long-term supply activity
Key Insight: The 90-day smoothing makes this metric far more reliable for identifying long-term behavioral trends than daily CDD.
Why 90D CDD Matters for On-Chain Analysis
The strength of 90D CDD lies in its ability to separate signal from noise.
Why Analysts Rely on It
Filters out short-term coin movement
Captures sustained spending of older coins
Reflects long-term holder conviction or hesitation
Helps identify market phases:
Accumulation
Distribution
Transition
Strongly correlated with macro cycle changes
Insight: Sustained long-term holder behavior over a 90-day period often precedes major shifts in market sentiment.
How to Read the 90D CDD Chart
Interpreting the chart requires focusing on trends, not isolated spikes.
High 90D CDD
Older coins being spent consistently over weeks or months
Distribution during extended rallies
Reactions to market stress or macro events
Structural activity from large, long-term holders
Low 90D CDD
Older coins remain dormant
Long-term holders accumulating or waiting
Reduced sell-side pressure
Calm or early recovery phases
Key Signals to Monitor
Multi-month peaks
Extended troughs
Inflection points
Divergences between price and 90D CDD
What High 90D CDD Means
Elevated 90D CDD readings indicate persistent distribution of older supply.
High 90D CDD Often Reflects
Long-term holders realizing profits
Sustained sell-side pressure
Distribution phases near market tops
Macro-driven reallocations
Why It Matters: Short-lived spikes can be ignored — prolonged elevation signals structural supply changes.
What Low 90D CDD Means
Low readings are often associated with strong holder conviction.
Low 90D CDD Typically Indicates
Minimal movement from long-term holders
Accumulation behavior
Reduced selling pressure
Market stabilization following capitulation
Insight: Extended periods of low 90D CDD frequently align with the early stages of long-term bottoms.
Understanding the Rolling 90-Day Window
The rolling window ensures the indicator reflects consistent behavior.
Why This Matters
Smooths volatility
Reduces overreaction to short-term events
Highlights sustained supply dynamics
Provides a macro-level view of coin movement
Example
If older coins move aggressively for a short period, the effect persists across the full 90-day window, signaling deeper structural behavior.
Historical Patterns in 90D CDD
Across multiple cycles, 90D CDD exhibits repeatable characteristics.
Bull Markets
Elevated 90D CDD
Long-term holders distribute into strength
Peaks often coincide with cycle tops
Bear Markets
Suppressed 90D CDD
Prolonged accumulation
Dormant supply reflects weak sell interest
Transitions
Rising 90D CDD during early recoveries
Sharp declines after capitulation
Trend reversals in 90D CDD often precede price reversals
How Traders & Analysts Use 90D CDD
Practical Applications
Identifying distribution phases
Confirming accumulation zones
Assessing long-term holder sentiment
Tracking structural supply shifts
Supporting strategic, multi-month positioning
Validating macro market narratives
Limitations of the 90D CDD Metric
Important Considerations
Reduced sensitivity to short-term price action
Does not identify individual wallets or entities
Small movements of very old coins can distort readings
Best used alongside price, volume, and supply metrics
Inherently lagging due to its rolling nature
Pro Tips for Using the 90D CDD Chart
Focus on trend changes, not absolute values
Monitor prolonged low readings for accumulation
Treat sustained uptrends as potential distribution
Compare 90D CDD slope with price momentum
Use high 90D CDD as a caution signal during rallies
Use low 90D CDD to identify structurally strong markets
Frequently Asked Questions (FAQ)
1. What does 90D Coin Days Destroyed measure?
The total coin days destroyed over a rolling 90-day period, representing long-term holder spending behavior.
2. Why use a 90-day version instead of daily CDD?
It removes short-term noise and reveals deeper structural trends.
3. What does high 90D CDD mean?
Sustained spending of older coins, often associated with distribution or market stress.
4. What does low 90D CDD mean?
Dormant long-term supply, typically signaling accumulation or stability.
5. Does 90D CDD predict market tops or bottoms?
Not directly, but historical extremes often align with cycle transitions.
6. Can very old coins distort the metric?
Yes — older coins carry disproportionate weight due to accumulated age.
7. Is 90D CDD suitable for long-term analysis?
Yes. It is one of the most effective macro-level on-chain indicators.


.jpg)


%20.png)